Portfolio
I’m a firm believer that great things happen when curiosity meets hard work. Here, I’ve brought together projects that reflect my journey of learning, growing, and solving real-world challenges with data.
/ Portfolio
/ Fueling Costs in a Volatile World
Fueling Costs in a Volatile World: How Exchange Rates Impact Gas Prices in Canada
Github's repository:
As someone passionate about forex and financial markets, I’ve always been curious how currency fluctuations affect everyday expenses. Living in Canada, one of the most visible and impactful costs is fuel.
This project combines my interest in data analysis and macro trends with a real-world issue: how changes in USD/CAD and CNY/CAD influence gasoline prices across Canadian provinces. It allowed me to turn public data into insights that matter to both individuals and businesses.
Link to the datasets:
RESEARCH QUESTIONS:
-
Which provinces pay the most for fuel on average?
→ Understand regional disparities in gasoline costs.
-
Does a weaker Canadian dollar correlate with higher fuel prices?
→ Evaluate the macroeconomic influence of USD/CAD volatility.
-
Which provinces are most sensitive to exchange rate changes?
→ Reveal areas most impacted by currency-driven cost increases.
TOOLS USED:
- PostgreSQL + pgAdmin – for storage, querying, and data wrangling
- SQL – for table creation, joins, views, correlation, and aggregation
- Excel – for plotting or visual enhancements
- Bank of Canada – source of daily forex rates
- Statistics Canada – source of monthly gas prices
STEP-BY-STEP SQL WORKFLOW
After having a look at the datasets on Excel and cleaned them a bit, now is the time to load them into SQL.
Then, we found out our forex_rates dataset is daily, but fuel prices are monthly. So we aggregated daily rates into monthly averages:

DATE_TRUNC('month', date) removes the day so we can group by month.
AVG() calculates the monthly average rate for each currency.
Interpretation:
This lets us compare monthly fuel prices directly with monthly average exchange rates.
We then created a combined view

This combines both tables so we can analyze fuel cost + exchange rate in the same row.

INSIGHTS FROM THE DATA
Insights 1 - Most Expensive Provinces on Average:

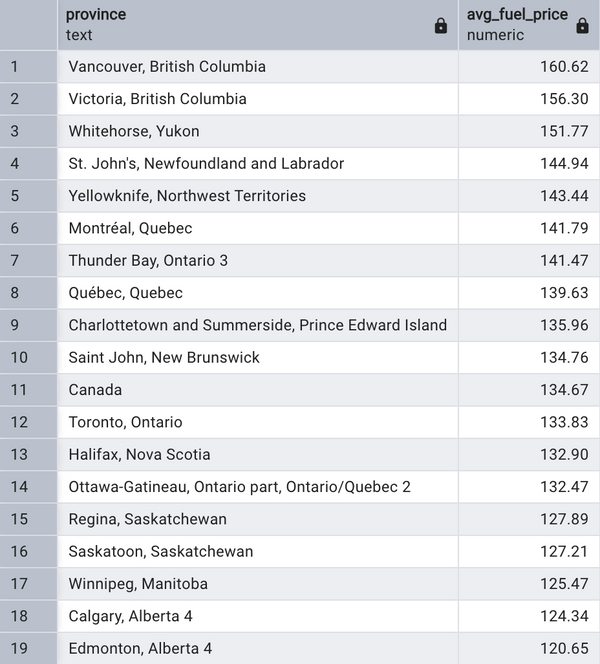
Interpretation:
This tells us the average fuel price in each Canadian province over the last 8 years.
British Columbia and Newfoundland are the most expensive places to buy gas.
That’s likely due to a mix of higher fuel taxes, more remote infrastructure, and transportation costs.
This is important for delivery companies, government policy makers, and anyone managing fuel budgets across provinces.
Insights 2 - Do Exchange Rates Drive Fuel Prices?


Interpretation:
This query compares monthly fuel prices with the monthly exchange rate between the US dollar and the Canadian dollar (USD/CAD).
The trend shows that when the Canadian dollar is weaker (higher USD/CAD), fuel prices tend to go up.
That makes sense because oil is priced globally in USD and if CAD loses value, we pay more.
This is useful for any business that relies on fuel costs, like airlines, truck fleets, and even public transit budgeting.
Insights 3 - Which Provinces Are Most Sensitive?

Interpretation:
This query calculates how closely fuel prices move in sync with exchange rates.
A high correlation means: when the dollar gets weaker, fuel prices in that province almost always go up.
Ontario and British Columbia had the strongest link to exchange rate volatility.
That tells us people in those provinces are more sensitive to global pricing pressures, and may benefit from targeted policies or fuel hedging strategies.

The project ends here. You can view the materials in this project on: Github
To check my other projects: Portfolio